Overview
The IUCN Red List is the world's most comprehensive inventory of species' conservation status. It classifies species from Least Concern through to Extinct — but a critical subset are labelled Data Deficient (DD): species where available information is too poor to even assign a threat category.
This is not a safe status. A DD classification often reflects under-resourced field research rather than genuine absence of threat. Left unaddressed, these species fall through the cracks of conservation policy.
The goal: Train a classification model on species with known threat status, then use it to predict whether Kenya's 335 Data Deficient species are likely to be Threatened or Non-Threatened — surfacing candidates for urgent field research.
The Dataset
Data was sourced from the IUCN Red List bulk download, comprising 8 CSV files covering different aspects of species records:
| File | Rows | Description |
|---|---|---|
| simple_summary | 41,949 | Core taxonomy, Red List category, population trend |
| all_other_fields | 41,949 | Extended metadata fields |
| habitats | 109,594 | Habitat type associations per species |
| threats | 88,999 | Threat codes and stresses per species |
| research_needed | 82,263 | Research priority codes |
| conservation_needed | 50,414 | Conservation action codes |
| usetrade | 18,524 | Human use and trade records |
| countries | 431,396 | Country-level occurrence records |
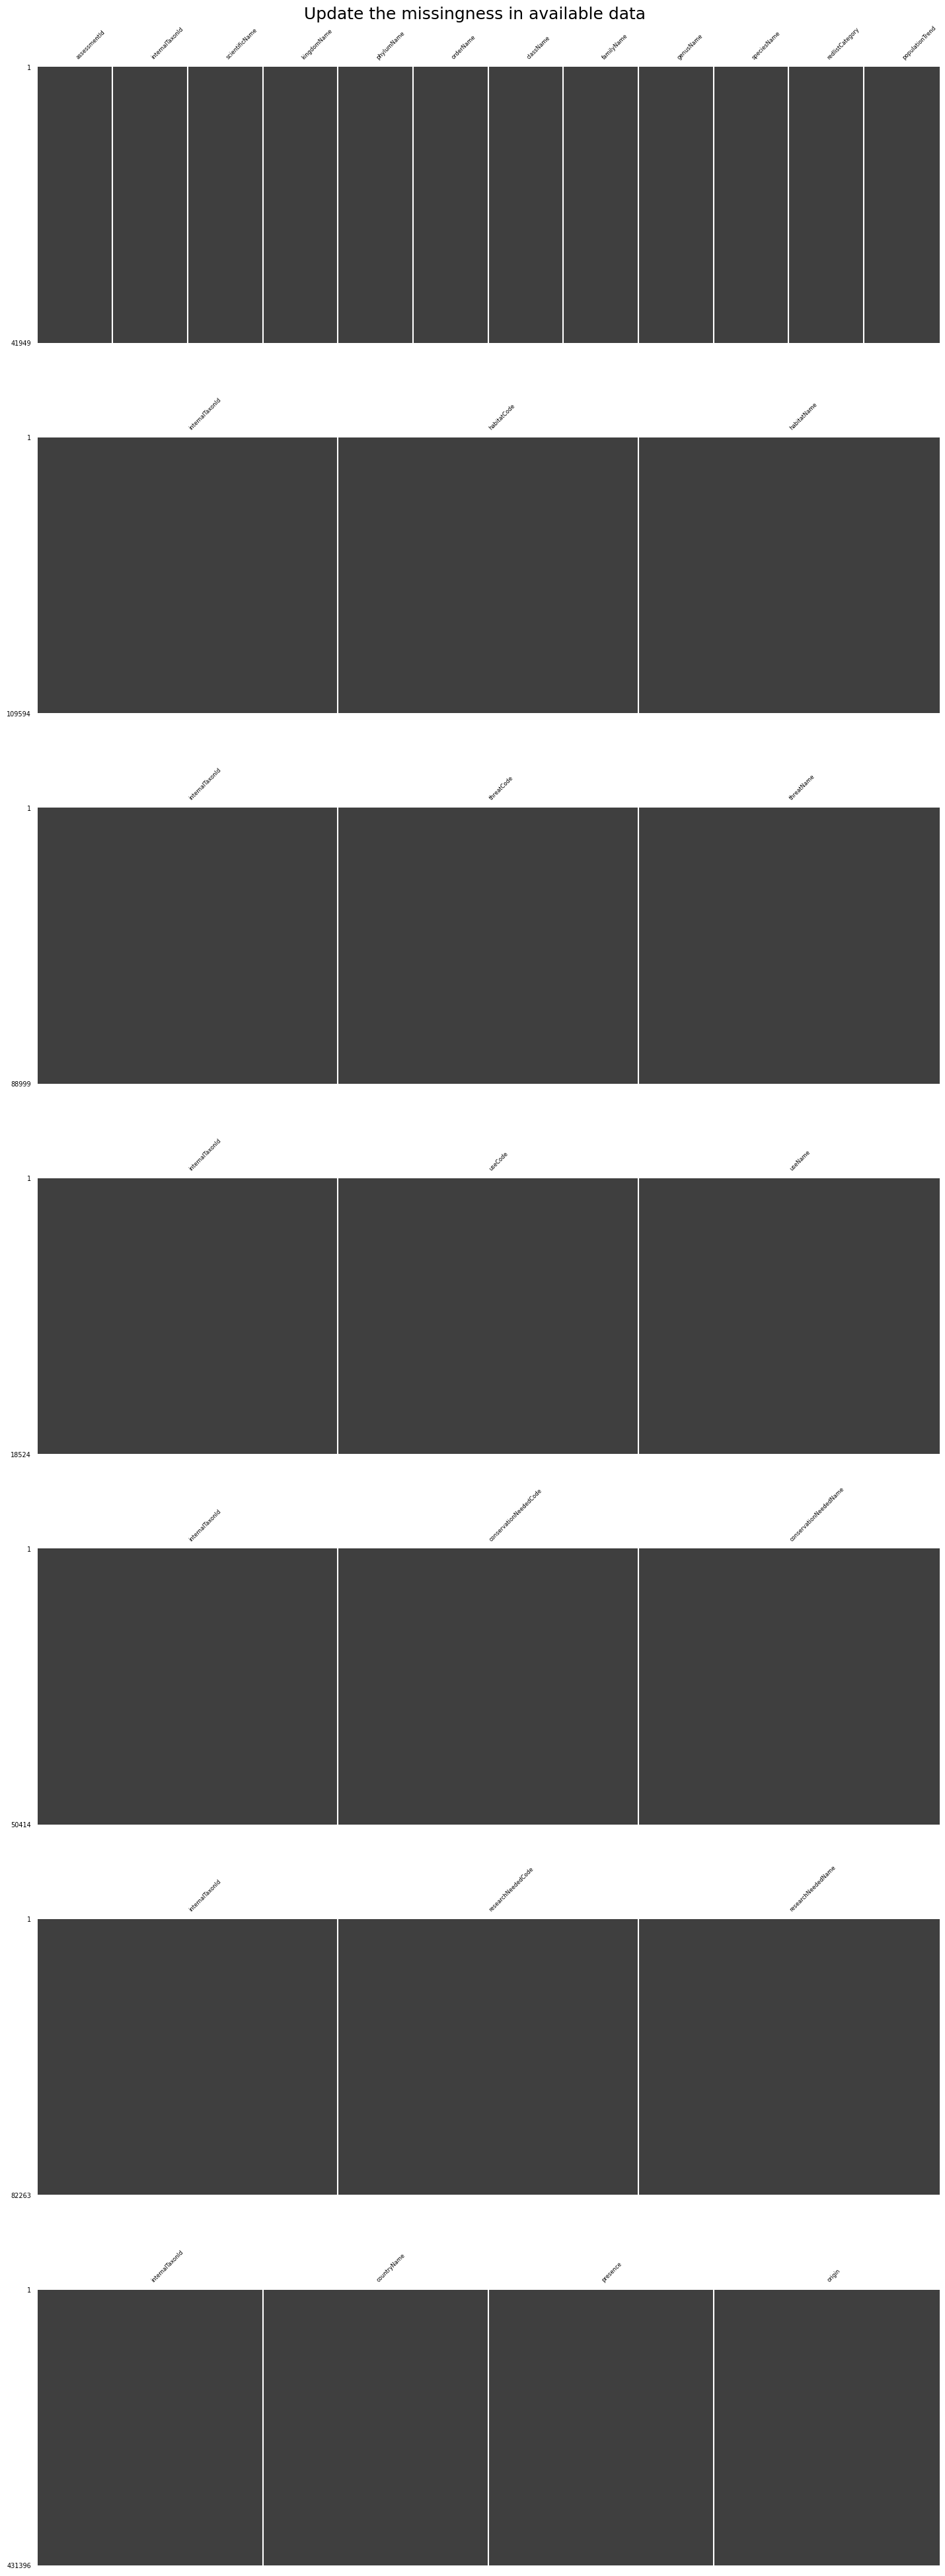
Missingness & Deduplication
Before analysis, the data needed cleaning. Initial inspection revealed significant missing values across several fields.
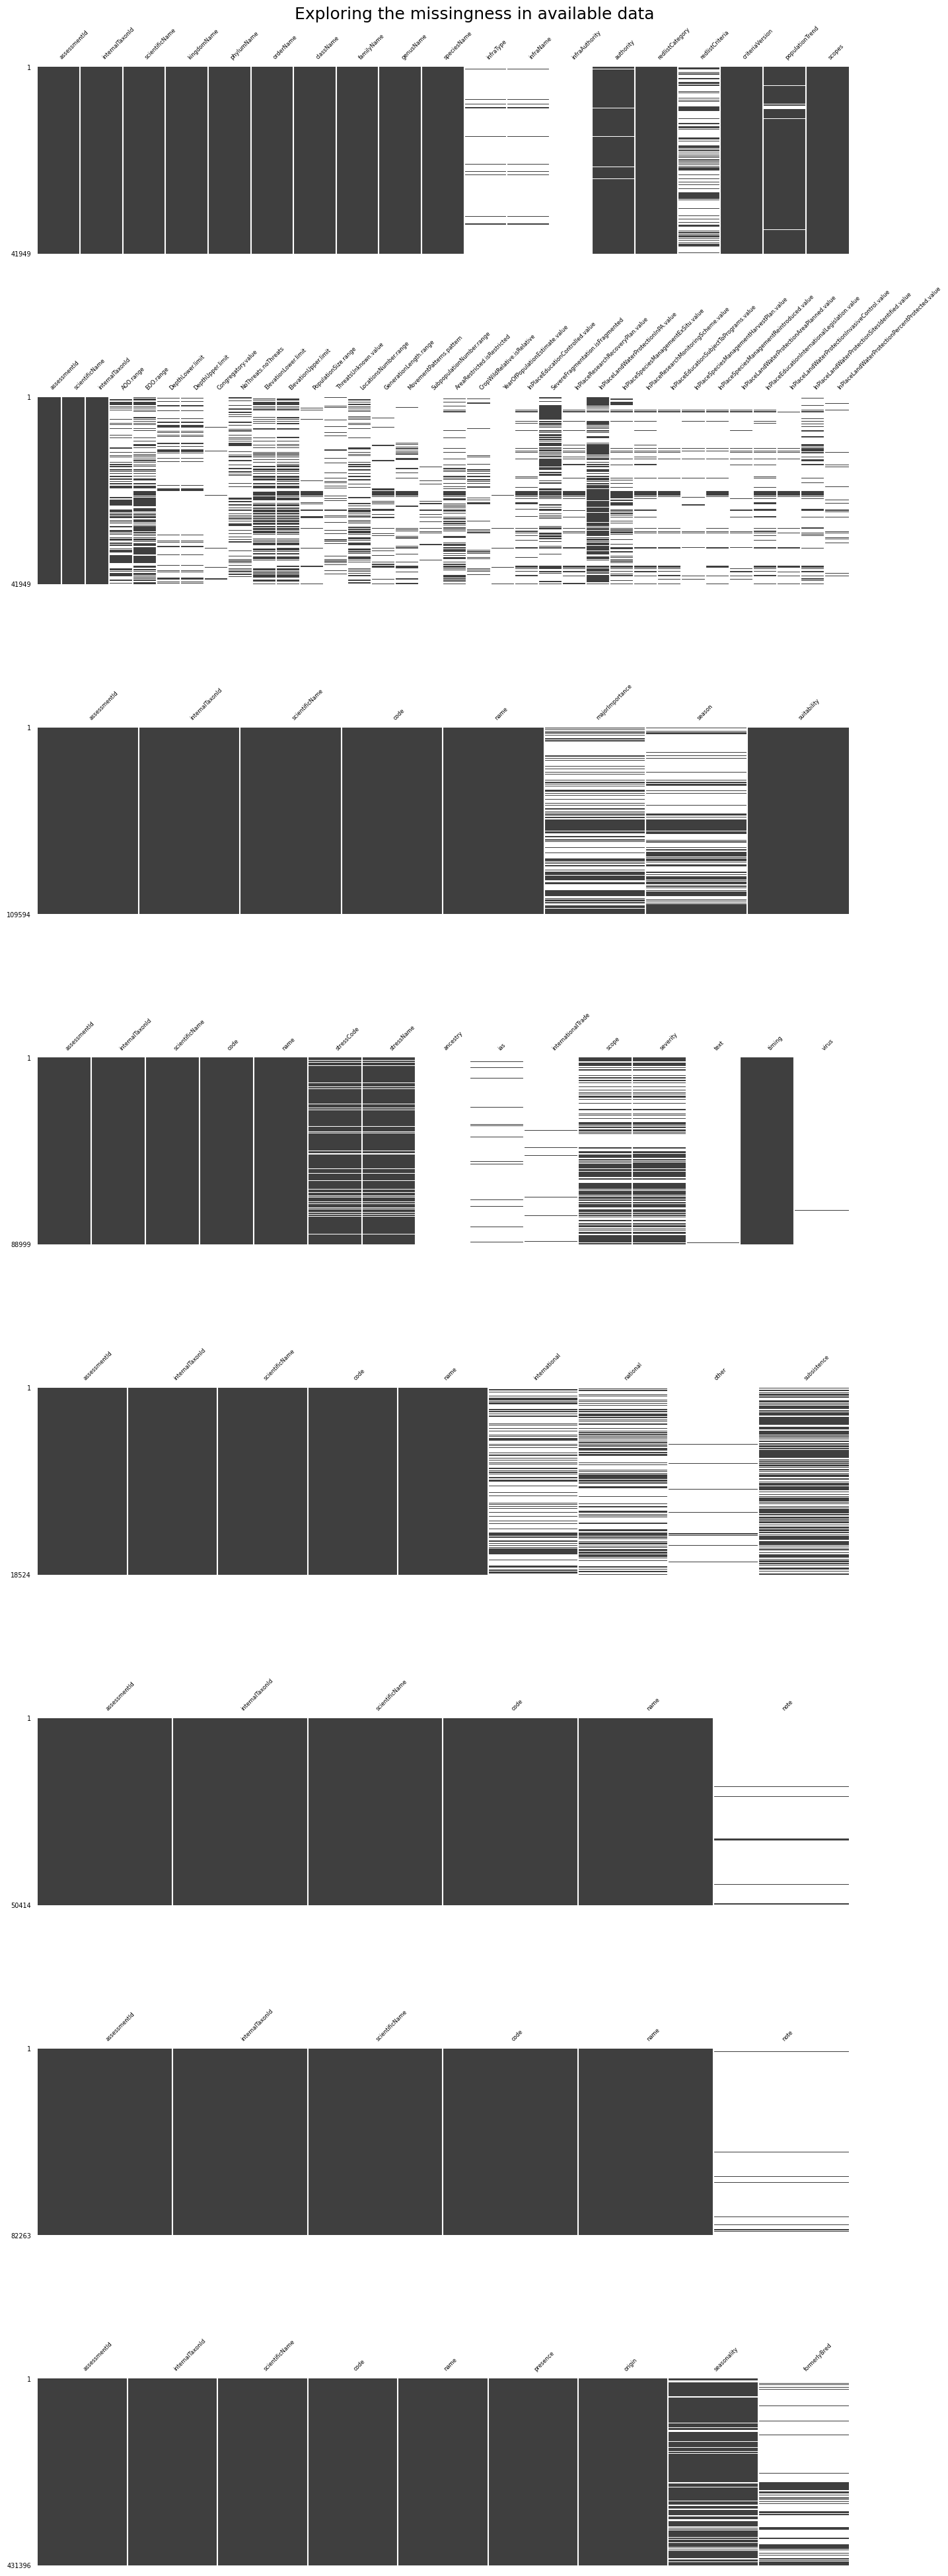
The primary join key (internalTaxonId) had 2,925 duplicated rows, retained as first occurrences and removed. After deduplication:
Exploratory Data Analysis
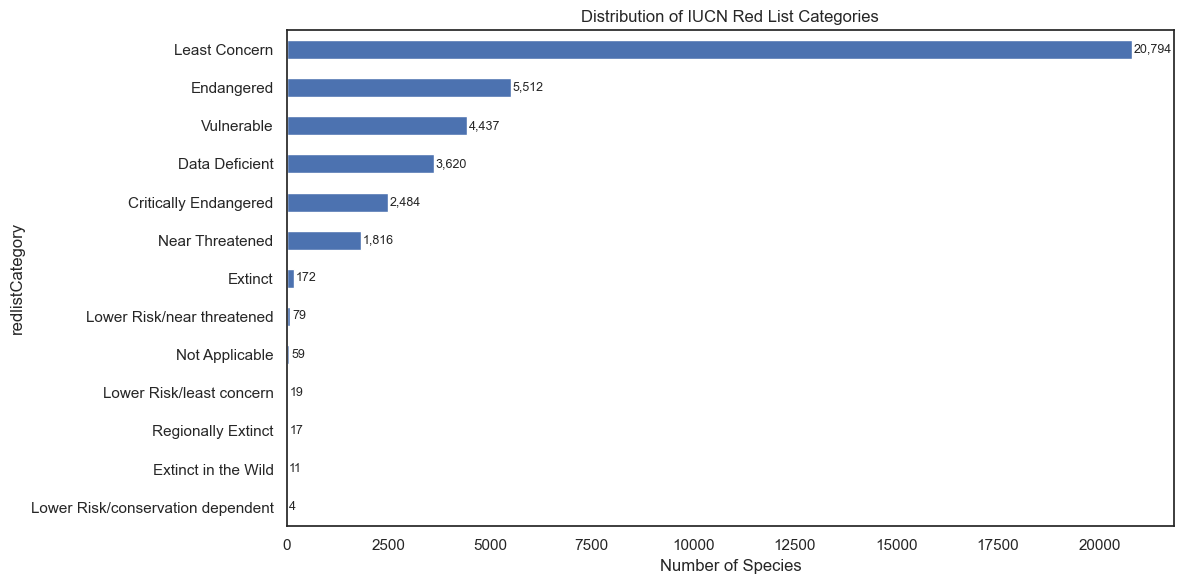
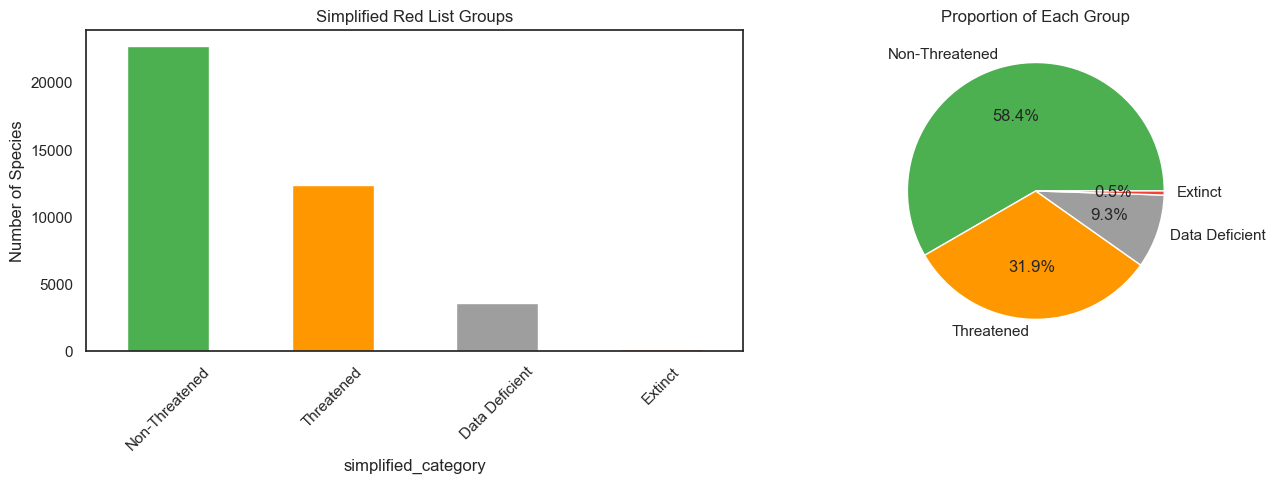
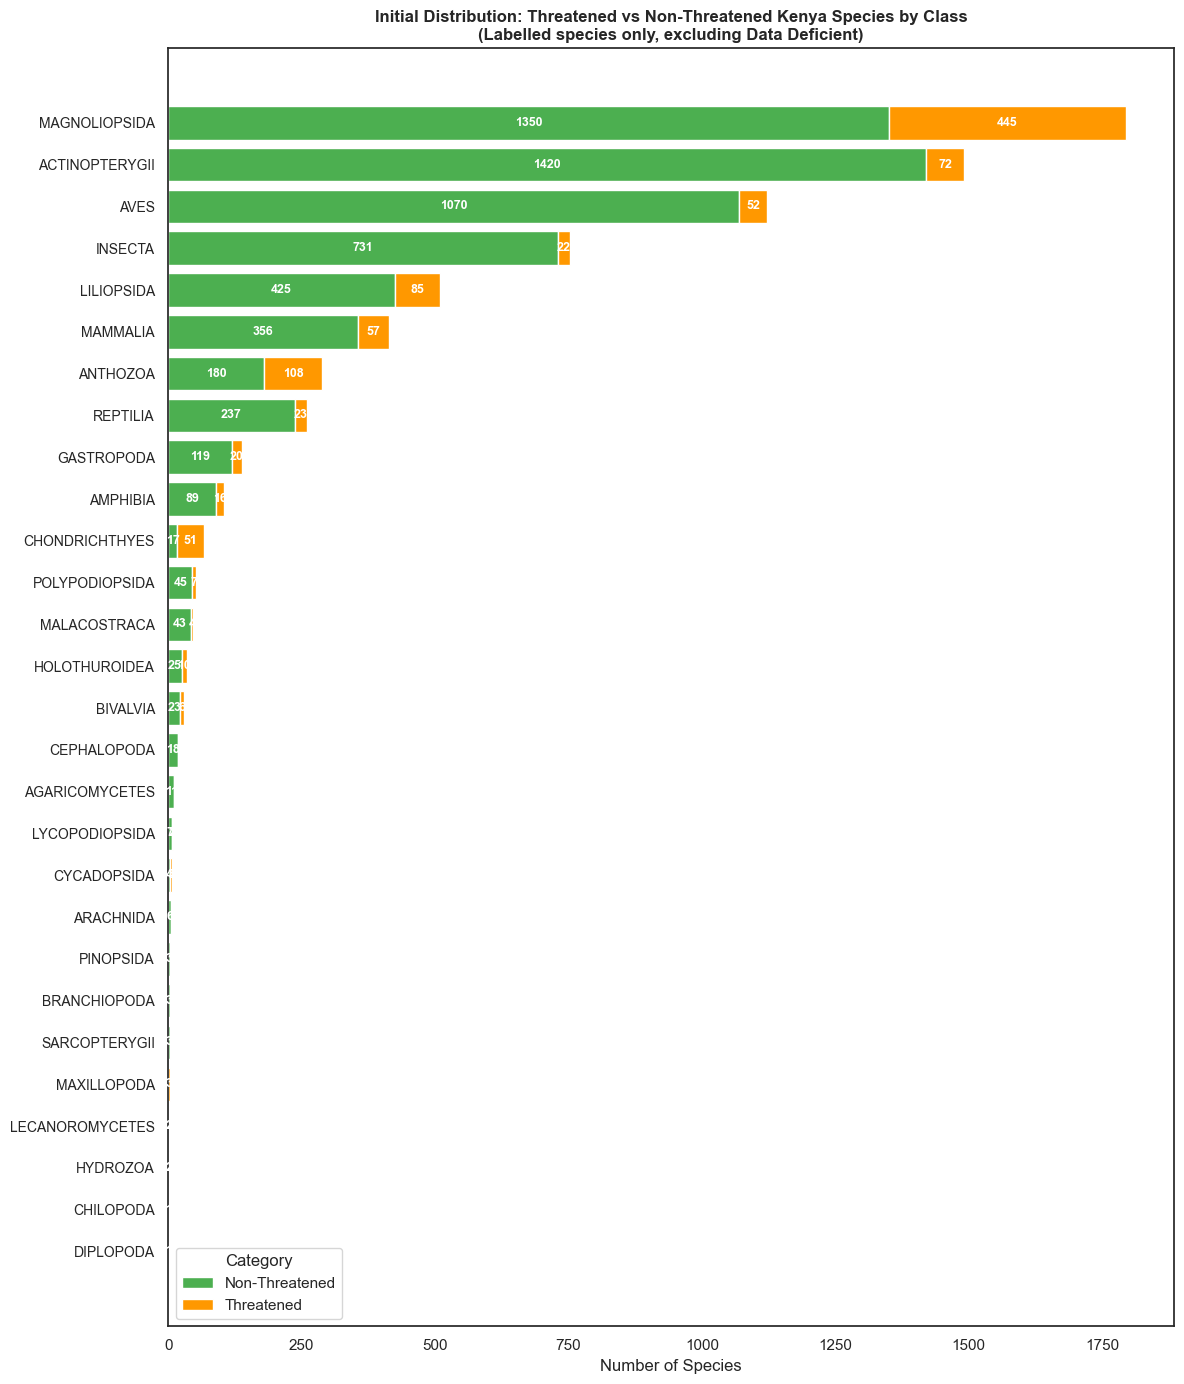
Red List Category Imbalance
For modelling purposes, the 13 IUCN categories were collapsed into three simplified groups:
- Threatened — Vulnerable, Endangered, Critically Endangered
- Non-Threatened — Least Concern, Near Threatened, Lower Risk/*
- Extinct — Extinct, Extinct in the Wild, Regionally Extinct
Data Deficient species were excluded from training and reserved as prediction targets.
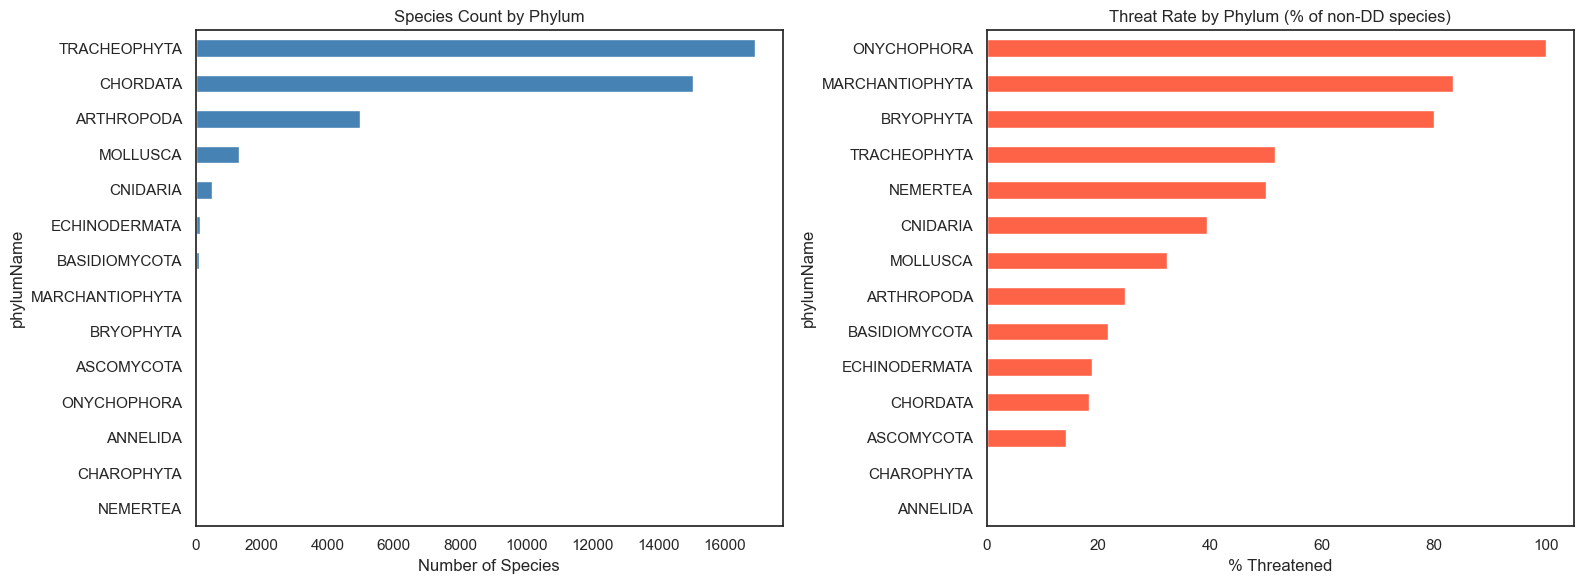
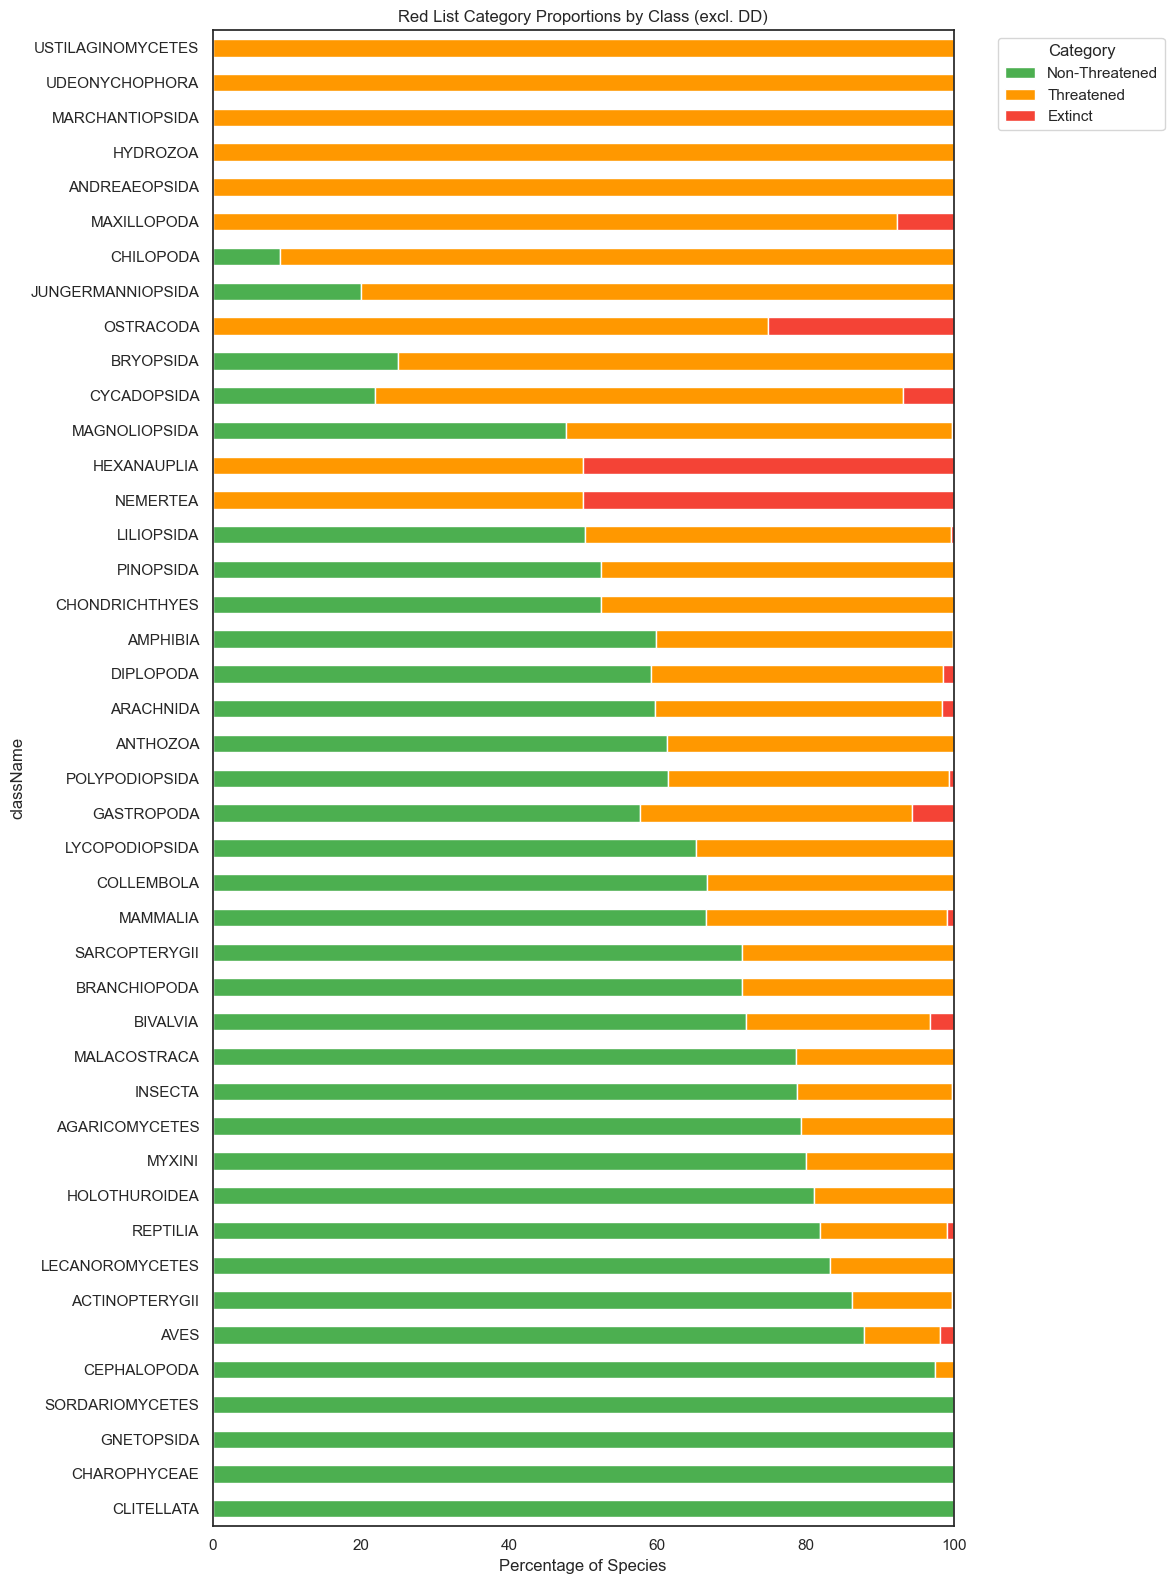
Taxonomic Signals
Not all taxonomic groups face equal risk. Threat rates vary substantially by phylum and class — making taxonomy a potentially powerful predictor.
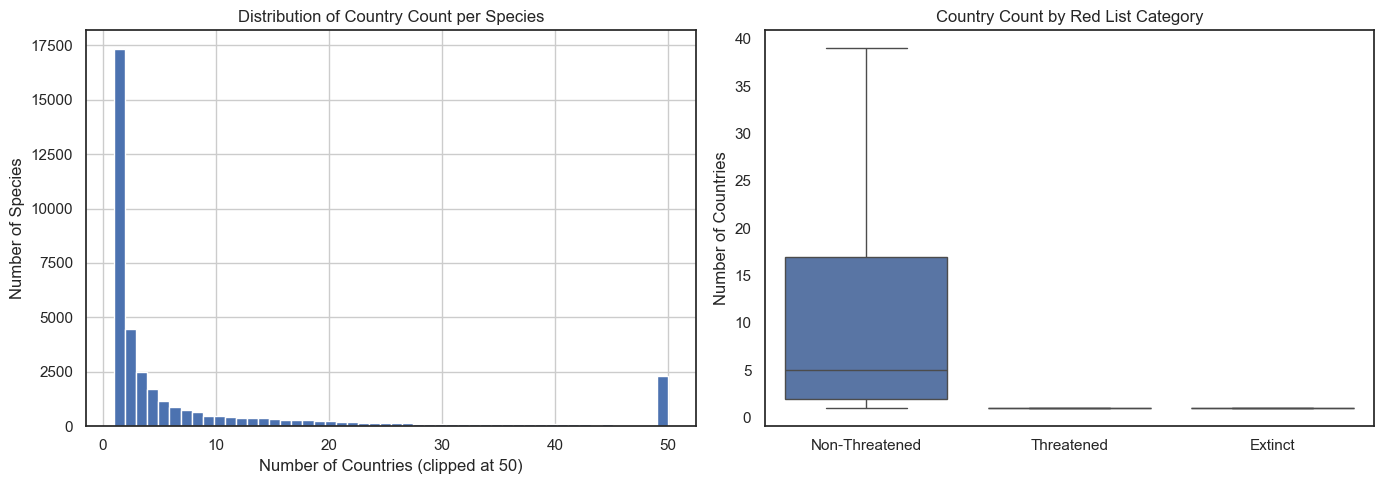
Geographic Range
Species occurring in fewer countries tend to have narrower ranges, making them more vulnerable to localised threats and habitat loss.
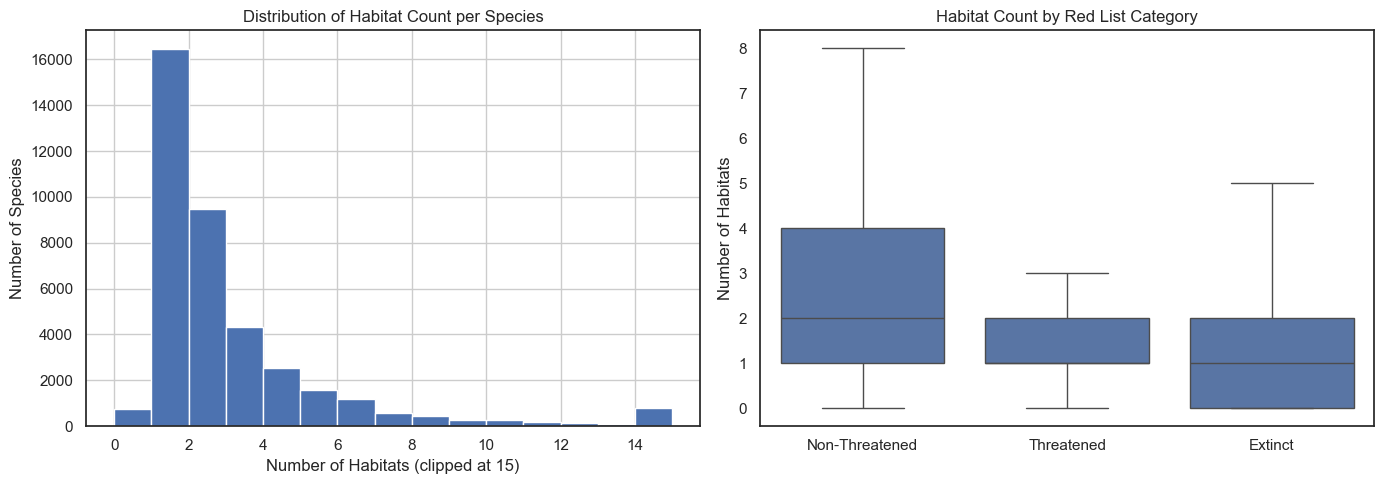
Habitat Specialisation
Similarly, species dependent on fewer habitat types have less adaptive buffer against environmental change.
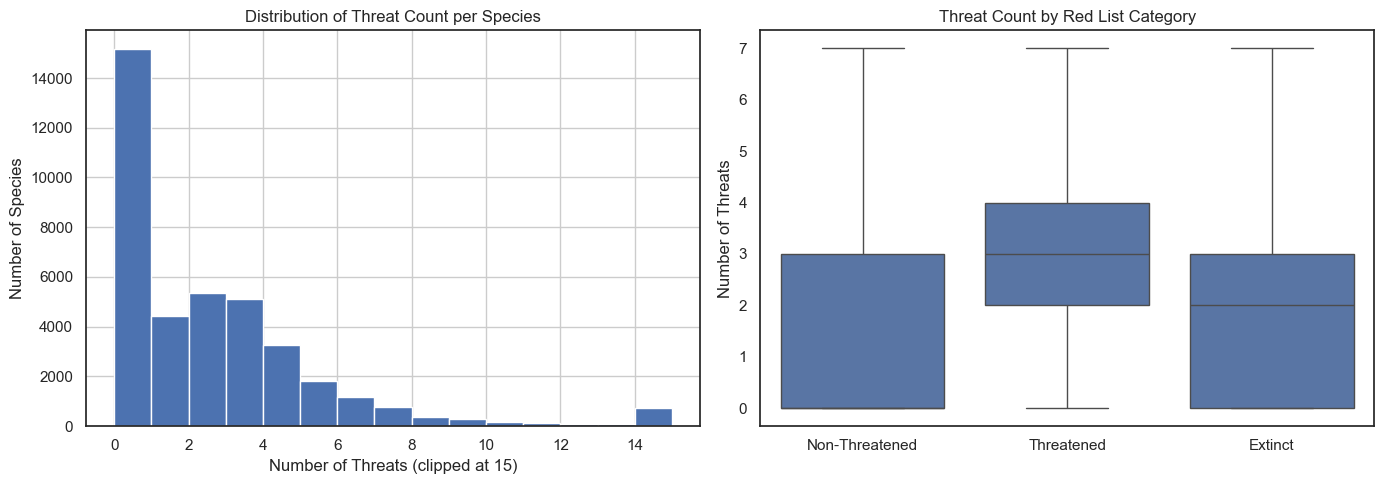
Threat Documentation
Species with more documented threats are, unsurprisingly, more likely to be classified as Threatened. But this also reveals a critical bias:
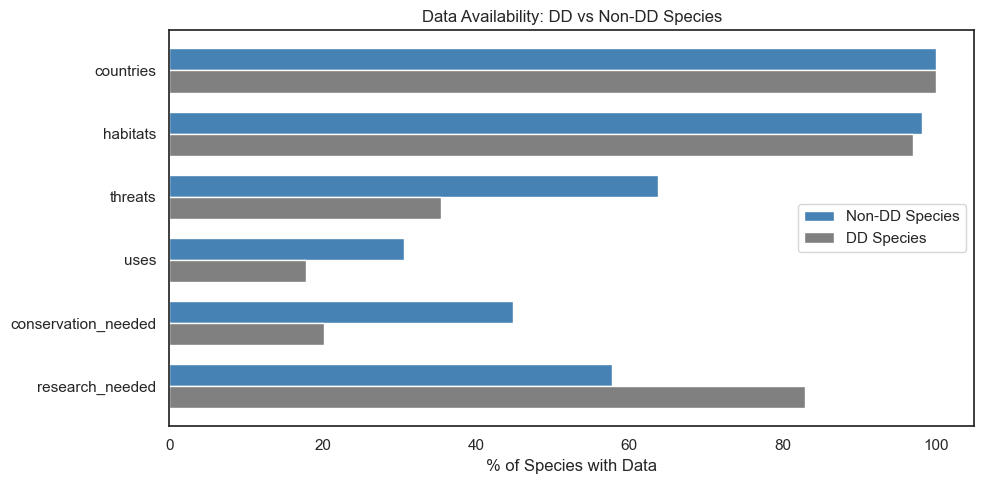
Data Availability for DD Species
A key challenge: Data Deficient species are deficient not just in their Red List assessment, but in the features the model relies on.
Feature Engineering
Eight candidate features were selected based on EDA findings and data availability across DD species:
| Feature | Type | Source | Rationale |
|---|---|---|---|
| className | Categorical | simple_summary | Taxonomic group is a proxy for ecological vulnerability |
| populationTrend | Categorical | simple_summary | Declining trend strongly associated with threatened status |
| n_countries | Numeric | countries (count) | Proxy for range size |
| n_habitats | Numeric | habitats (count) | Habitat breadth / specialisation |
| n_threats | Numeric | threats (count) | Documented threat burden |
| n_uses | Numeric | usetrade (count) | Human exploitation pressure |
| n_conservation | Numeric | conservation_needed (count) | Level of conservation attention |
| n_research | Numeric | research_needed (count) | Documented knowledge gaps |
className and populationTrend were one-hot encoded, producing 52 total features (6 numeric + 46 binary). The dataset was split 80/20 into training (28,163 species) and test (7,041 species) sets.
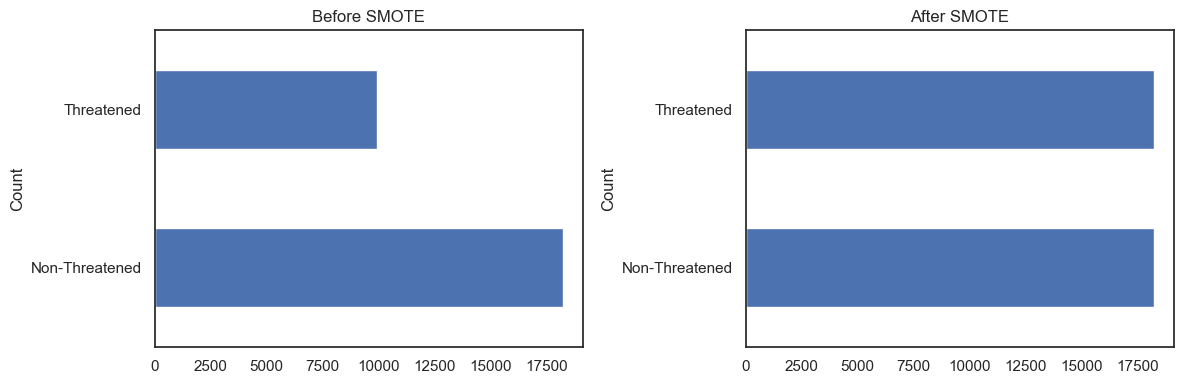
Handling Class Imbalance
Non-Threatened species significantly outnumber Threatened ones — a ratio that would bias a naïve classifier toward the majority class. SMOTE (Synthetic Minority Over-sampling Technique) was applied to the training set to generate synthetic Threatened examples and balance the distribution before fitting.
Model Training + Evaluation
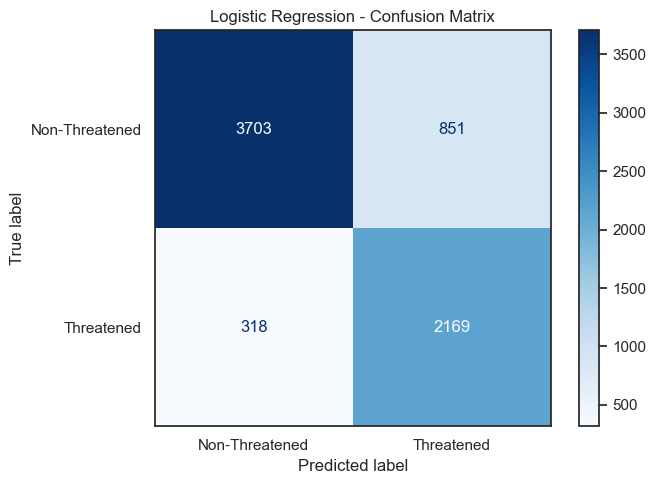
Two classifiers were trained and evaluated: Logistic Regression and Random Forest.
| Model | Test Accuracy | Test F1 (weighted) | 5-Fold CV F1 |
|---|---|---|---|
| Logistic Regression | 83.4% | 83.7% | 84.0% ± 0.5% |
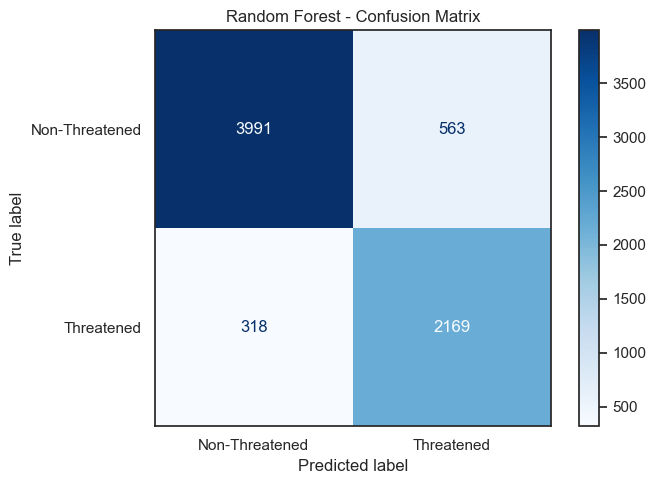
| Random Forest | 87.5% | 87.6% | 90.1% ± 1.8% |
Random Forest outperformed Logistic Regression on all metrics and was selected for final predictions.
Feature Importance
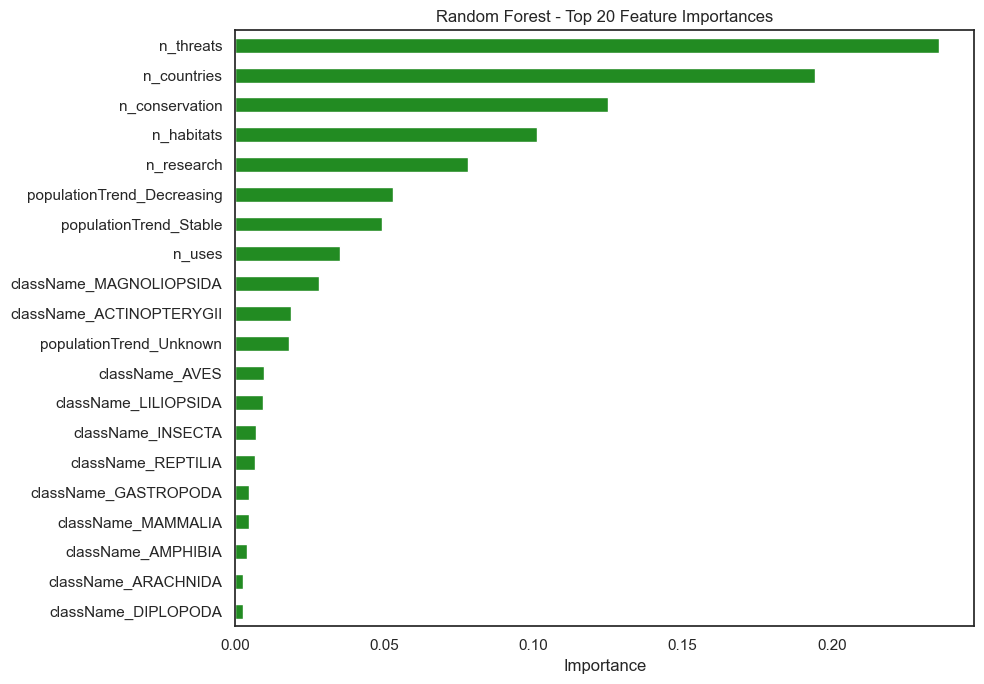
n_countries, n_habitats, and n_threats — dominate. Population trend categories and taxonomic class are the most informative categorical signals.Results: Kenya's Data Deficient Species
335 species occurring in Kenya were identified as Data Deficient. Using the Random Forest model, each was assigned a predicted threat status.
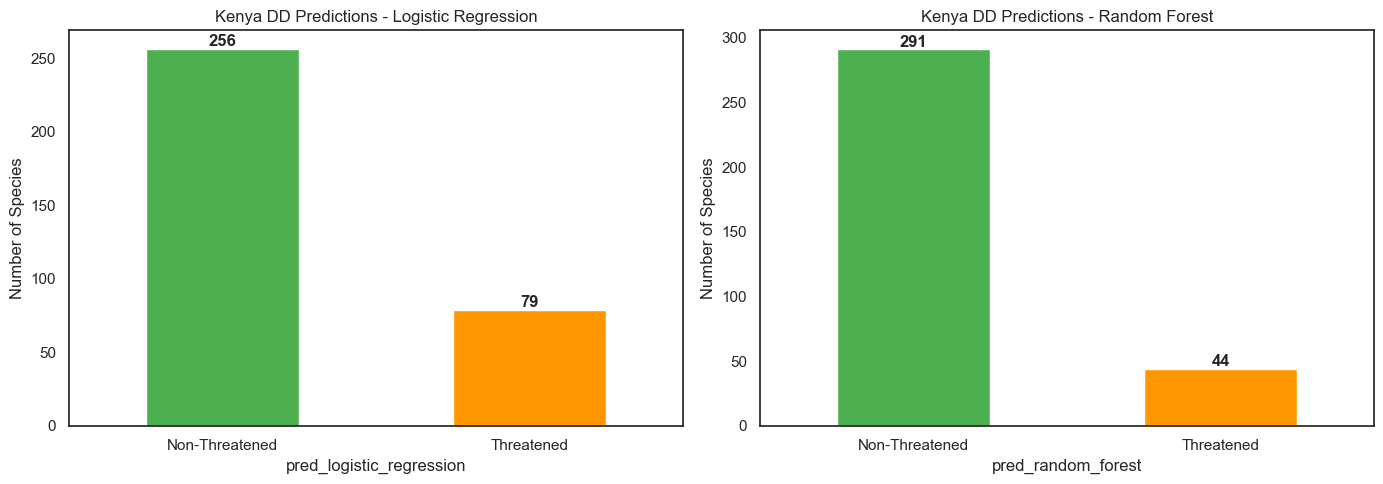
The 44 RF-predicted Threatened species span multiple taxonomic classes — with fish (ACTINOPTERYGII), invertebrates, and mammals most represented among the flagged species.
Limitations
These predictions are best treated as research prioritisation hypotheses, not definitive assessments.
- Sparse data bias: DD species are data-deficient by definition. With only 35% threat documentation coverage (vs 64% for non-DD), the model sees a less complete picture and may systematically underestimate risk.
- SMOTE caveats: Synthetic oversampling generates plausible but artificial training examples. Edge cases near class boundaries may not reflect real ecological patterns.
- Collapsed categories: Binary Threatened / Non-Threatened classification loses meaningful nuance — a Vulnerable and a Critically Endangered species are treated identically.
- Count features only: Threat type and habitat type were reduced to simple counts. Qualitative differences (e.g., habitat destruction vs invasive species) are invisible to the model.
- No external validation: Predictions have not been validated against expert assessments or field surveys. They should prompt investigation, not replace it.
References + Acknowledgements
Data Source
IUCN Red List of Threatened Species. Version 2024-2. www.iucnredlist.org. Downloaded November 2024.
Methods
- Chawla, N.V., Bowyer, K.W., Hall, L.O., & Kegelmeyer, W.P. (2002). SMOTE: Synthetic Minority Over-sampling Technique. Journal of Artificial Intelligence Research, 16, 321–357.
- Breiman, L. (2001). Random Forests. Machine Learning, 45(1), 5–32.
Libraries
pandas · scikit-learn · imbalanced-learn · matplotlib · seaborn
Acknowledgements
This project was completed as part of the Machine Learning module at Zindua School, Nairobi. Thanks to the IUCN Red List team for making bulk species data publicly available to researchers.